
How ATR Measures Crypto Volatility for Beginners
Simple explanation of ATR in crypto: measures average price movement per candle and helps set stops and position size.
ATR tells me one thing fast: how much a crypto price is moving per candle. It does not tell me if price will go up or down. If ATR is high, price swings are larger and risk is higher. If ATR is low, price action is tighter and calmer.
Here’s the short version:
- ATR = average price movement over a set period, often 14 candles
- It uses true range, which looks at:
- the current high minus low
- the current high minus the previous close
- the current low minus the previous close
- I read ATR with the chart timeframe
- On a 1-hour chart, ATR shows the average move per hour
- On a daily chart, ATR shows the average move per day
- A reading like $100 ATR on BTC/USD on the 1-hour chart means Bitcoin has moved about $100 per hour on average over the last 14 hours
- ATR helps me:
- spot quiet vs. active market conditions
- set stop-loss distance
- adjust position size
- ATR does not work well by itself for entries, so I pair it with tools like SMA, RSI, or MACD
A simple way to use it:
- Add 14-period ATR to the chart
- Check if the current reading is low, flat, or climbing
- If ATR is climbing, give the trade more room
- If I use a larger stop, I cut position size to keep risk in check
One more point: I only compare ATR on the same coin and same timeframe. A daily ATR and a 1-hour ATR are not the same kind of reading, and a $3 ATR on one coin means something very different from $3 ATR on another. For cross-asset checks, I use ATR% = (ATR ÷ price) × 100.
| ATR condition | What it tells me | What I do |
|---|---|---|
| Low ATR | Tight, quiet market | Expect smaller moves; watch price closely |
| Rising ATR | Volatility is expanding | Use more stop room; cut size |
| High ATR | Large swings; more risk | Keep size smaller and risk controlled |
In short, I use ATR as a volatility gauge. It helps me match my stop and position size to the market’s current pace instead of using a random fixed dollar amount.
How ATR Measures Crypto Market Movement
ATR turns raw candle data into one simple number. With the standard 14-period setting, it takes the true range from each recent candle and averages those values into a single reading. That number shows, in plain U.S. dollar terms, how much a coin has been moving per candle on that chart.
Here’s the easy way to read it: if you’re on a 1-hour BTC/USD chart and the 14-period ATR shows $100, Bitcoin has been moving about $100 per hour on average over the last 14 hours. That move can be up, down, or sideways. ATR doesn’t care about direction. It just shows how much ground price is covering.
Reading ATR Across Different Timeframes
ATR only means something when you pair it with the chart timeframe. The same 14-period setting can give you a very different reading on a 15-minute chart than it does on a daily chart.
| Chart Timeframe | What 14-Period ATR Reflects | Useful For |
|---|---|---|
| 15-minute | Typical move per 15-minute candle over roughly the last 3.5 hours | Very short-term scalping or day trading |
| 1-hour | Typical move per hour over approximately the last 14 hours | Intraday volatility |
| 4-hour | Typical move per 4-hour candle over roughly the last 2–3 days | Swing trading |
| Daily | Typical move per day over about the last two weeks | Broader volatility picture |
A daily ATR of $1,500 on Bitcoin means BTC has been moving about $1,500 per day over the lookback window. On a calmer 1-hour BTC/USD chart, ATR may sit around $60–$80.
That’s why one simple habit helps a lot: look at the chart, ask what one candle stands for, and then read ATR as the average dollar move for that candle length.
Why ATR Works Well in Fast-Moving Crypto Markets
Crypto can move hard and fast. You’ll often see long wicks and sharp jumps from one close to the next open. ATR handles that well because its true range formula is built to include those moves.
When a candle prints a long upper or lower shadow, that bigger range gets pulled into the true range calculation. As those larger values are averaged, ATR moves higher. The same thing happens when price jumps between the previous close and the current high or low. ATR catches that gap too.
That gives you a better read on market activity than looking at candle bodies alone. A rising ATR usually tells you the market is getting more active and price is moving farther per candle. If ATR is flat or dropping, conditions are calmer.
Before making a trading or buying decision, ATR can give you a quick snapshot of how fast the market is moving right now, not just how busy the chart looks at first glance.
sbb-itb-0796ce6
How to Read Low and High ATR Values
Once you know ATR shows the typical candle size, you can use it to see whether a market is tightening up or opening up. There’s no fixed line for what counts as “high” or “low” ATR. You have to compare it with that same asset’s recent ATR on the same timeframe.
Low ATR Often Signals a Calm or Compressed Market
Low ATR usually means smaller price ranges and quieter trading. You’ll often see this during consolidation or after a strong move starts to cool off. The main point: low ATR tells you the market is compressed. It does not tell you where price will go next.
High ATR Points to Faster Moves and Higher Risk
High ATR means price is swinging faster and risk is higher. In plain English, each candle covers more ground, so trades can breathe hard in both directions. That’s why stops often need more room to survive normal volatility.
| Condition | Low ATR Environment | High ATR Environment |
|---|---|---|
| Market state | Compressed; price moving in tight ranges | Expanding; price covering more ground per candle |
| Risk level | Lower immediate dollar risk per candle | Higher dollar risk; moves can reverse quickly |
| Beginner implication | Good time to observe and plan | Reduce position size and widen stops appropriately |
Use ATR Percent to Compare Volatility Across Assets
Raw ATR works best when you’re looking at a single chart. ATR% is better when you want to compare assets with very different prices.
ATR% = (ATR ÷ current price) × 100
For example, a $100 coin with a $3 ATR has a 3% ATR. That makes volatility much easier to compare across assets.
You can then use that reading to help set stop distance and position size.
How Beginners Can Use ATR Step by Step
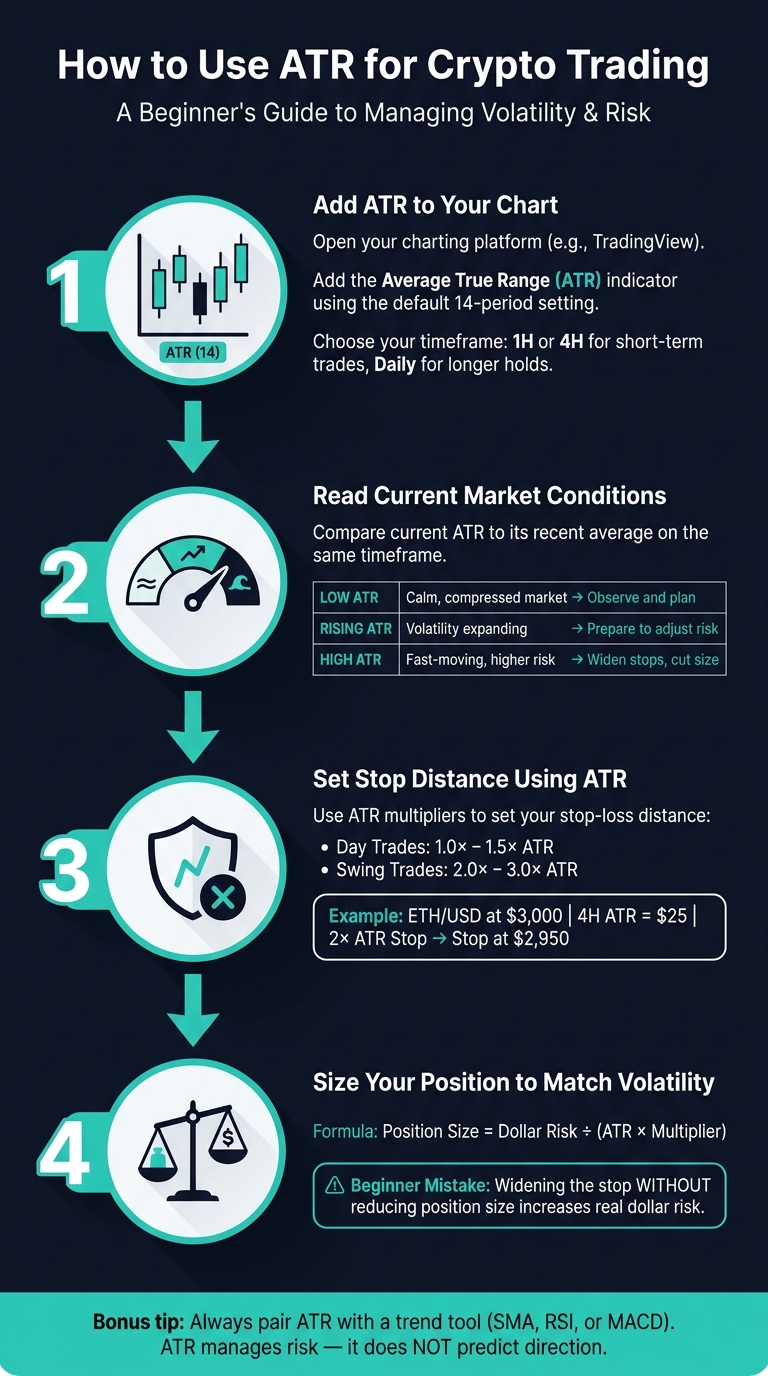
How to Use ATR for Crypto Trading: Step-by-Step Guide
Add ATR to a Chart and Read the Market Conditions
Start with a candlestick chart for BTC/USD or ETH/USD on your charting platform. Then choose a timeframe that fits the way you want to trade:
- 1-hour or 4-hour charts for short-term trades
- A daily chart if you're thinking in days or weeks
Next, open the Indicators menu, search for Average True Range (ATR), and add it using the default 14-period setting. Once it's on the chart, ATR shows up as a separate line below price.
Now compare the current ATR reading with its recent average on that same timeframe. Here's a simple example: if BTC's daily ATR has been sitting around $400–$600 and then jumps to $1,000, that usually means volatility has picked up. ATR works like a volatility gauge. It shows how much the market is moving, but it does not tell you whether price is more likely to go up or down.
Once you know if volatility is heating up or cooling off, you can use that reading to shape your risk.
Use ATR to Set Stop Distance and Position Size
A common rule of thumb is to use about 1.0×–1.5× ATR for day trades and 2.0×–3.0× ATR for swing trades.
Let’s make that concrete. Say you buy ETH/USD at $3,000 on a 4-hour chart, and the 14-period ATR is $25. If you use a 2× ATR stop, your stop-loss goes at $2,950. If ATR later climbs to $40 during a more active stretch, a 2.5× ATR stop would place the stop at $2,900. That’s the whole point: the stop changes with market conditions instead of relying on some random fixed dollar amount.
Position size is just as important. A simple formula is: Position size = dollar risk per trade ÷ (ATR × multiplier). When volatility goes up, your position should get smaller if you want to keep the same dollar risk.
That’s where many beginners slip up. They widen the stop because ATR is higher, but they don’t reduce the position size. On paper, it can look fine. In practice, it means more money is at risk. Keep your dollar risk per trade steady, and let the formula handle the rest.
Pair ATR With Other Tools Before Acting on a Trade
ATR helps with risk, not direction. So before you enter a trade, pair it with a tool that helps you judge trend or momentum.
A 50-period or 200-period simple moving average (SMA) can help show whether price is in an uptrend or downtrend. RSI or MACD can help flag momentum shifts or overbought/oversold conditions.
Here’s a practical way to use that setup. If BTC is trading above its 200-day SMA, RSI is not flashing overbought, and ATR is high but stable, a trend-following trader may look at a long position. But the entry still needs ATR to shape the trade: a wider stop and a smaller position size to match the volatility. ATR tells you how to handle risk. It does not tell you if the trade setup is valid.
Key Takeaways on ATR for Crypto Beginners
Now that you know how ATR works, here’s the quick version.
ATR shows how much a market is moving. It does not tell you which way price will go. Think of it as a fast volatility check before you place a trade.
When ATR is low, the market usually has smaller ranges and tighter price action. When ATR is high, price tends to swing more, and risk goes up with it. That gives you a simple way to judge whether a trade needs more room or less.
One thing matters a lot here: compare ATR only within the same asset and timeframe. A 1-hour chart and a daily chart can show very different volatility levels, even for the same coin.
| ATR Condition | What It Often Signals | Beginner Response |
|---|---|---|
| Low ATR | Calm, compressed market | Expect smaller moves and watch for a possible breakout |
| Rising ATR | Volatility expanding | Widen stops and reduce position size |
| High ATR | Fast-moving, higher-risk conditions | Widen stops and reduce position size |
Check ATR before entry. Then set your stops and position size to fit current volatility. In plain English, ATR helps you match your risk to the market’s current speed.
FAQs
What is a good ATR for crypto?
A “good” ATR in crypto depends on what you're trying to do. Low ATR often means the market is calmer and moving at a slower pace. High ATR usually means bigger price swings and faster moves.
Since ATR measures the size of price movement in context, there isn’t one number that’s “good” for everyone. It comes down to your strategy and how much risk you're comfortable taking on.
Can ATR predict breakouts?
ATR measures volatility, not breakout direction. It shows how much price tends to move over a set period, which helps you tell if the market is quiet or moving fast.
When ATR starts climbing, it points to stronger market activity and often shows up before big price swings. For beginners, spikes in ATR can be a simple way to spot periods of higher interest or possible changes in market conditions.
How often should I change my ATR stop?
Don’t update your ATR stop on a set timetable. Update it when the ATR itself shows that market volatility has changed.
When the market is calmer, you can keep stops tighter. When price starts moving faster, widen them so they match the market’s larger normal swings. The key is to review and adjust at meaningful shifts in volatility, not after every small move.